Moving Averages: How to Use Them to Identify Market Trends
Moving Averages: How to Use Them to Identify Market Trends In technical analysis, one of the most reliable and widely used tools is the Moving Average (MA). Whether you trade forex, stocks, commodities, or indices, understanding how moving averages work can help you spot market direction, filter out noise, and make more informed trading decisions. […]
Moving Averages: How to Use Them to Identify Market Trends
In technical analysis, one of the most reliable and widely used tools is the Moving Average (MA). Whether you trade forex, stocks, commodities, or indices, understanding how moving averages work can help you spot market direction, filter out noise, and make more informed trading decisions. They act as a dynamic line that smooths out price data, making it much easier to see the underlying trend instead of reacting to random short-term price fluctuations.
This guide will explain exactly what moving averages are, the most common types, how to read them, and practical ways to use them to identify trends and potential entry or exit points. By the end, you will have a clear understanding of how to add this powerful tool to your trading strategy.
Why Use Moving Averages? Price charts can look chaotic at first glance, with prices moving up and down constantly. Moving averages simplify this picture by showing the average price over a specific period, helping you answer the most important question in trading: Is the market moving up, down, or sideways?
What Is a Moving Average?
A moving average is a technical indicator that calculates the average price of an asset over a set number of periods. As new price data becomes available, the oldest data points are dropped, and the average recalculates — hence the term “moving.” This creates a continuous line on your chart that follows the price action.
The main purpose of a moving average is to reduce the impact of random price spikes and volatility, giving you a clearer view of the overall trend. It does not predict future prices, but it helps you understand what the market is doing right now and where it is likely heading based on historical behavior.
The Two Most Popular Types of Moving Averages
While there are many variations, most traders focus on two main types: the Simple Moving Average and the Exponential Moving Average. Each has its own characteristics and best uses.
1. Simple Moving Average (SMA)
The Simple Moving Average is the most basic form. It calculates the average price by adding up the closing prices over a specific number of periods and then dividing the total by that number.
Formula:
SMA = (Sum of closing prices for N periods) ÷ N
Pros: Easy to calculate, easy to understand, and provides a smooth, consistent view of the trend. It is excellent for identifying long-term trends.
Cons: It gives equal weight to every price in the period, so it can react slowly to recent price changes. This delay can sometimes result in late signals.
2. Exponential Moving Average (EMA)
The Exponential Moving Average is more advanced. It places greater weight and importance on the most recent price data, making it more responsive to current market changes compared to the SMA.
Because it reacts faster, the EMA is preferred by short-term traders who want to catch trends early. However, this responsiveness also means it can produce more false signals during periods of low volatility.
Pros: Reacts quickly to price changes, ideal for short-term analysis and timely entry signals.
Cons: More sensitive to noise and sudden price spikes, which may lead to misleading signals if not used carefully.
SMA vs. EMA: Quick Comparison
| Feature | Simple Moving Average (SMA) | Exponential Moving Average (EMA) |
|---|---|---|
| Weighting | Equal weight to all prices | More weight to recent prices |
| Speed | Slower to react | Faster to react |
| Best Used For | Long-term trends, support/resistance | Short-term trends, timely signals |
| Signal Reliability | Fewer false signals | More signals, but more noise |
How to Use Moving Averages to Identify Market Trends
The most common and effective way to use moving averages is to determine the direction of the trend. There are three basic market conditions you will see:
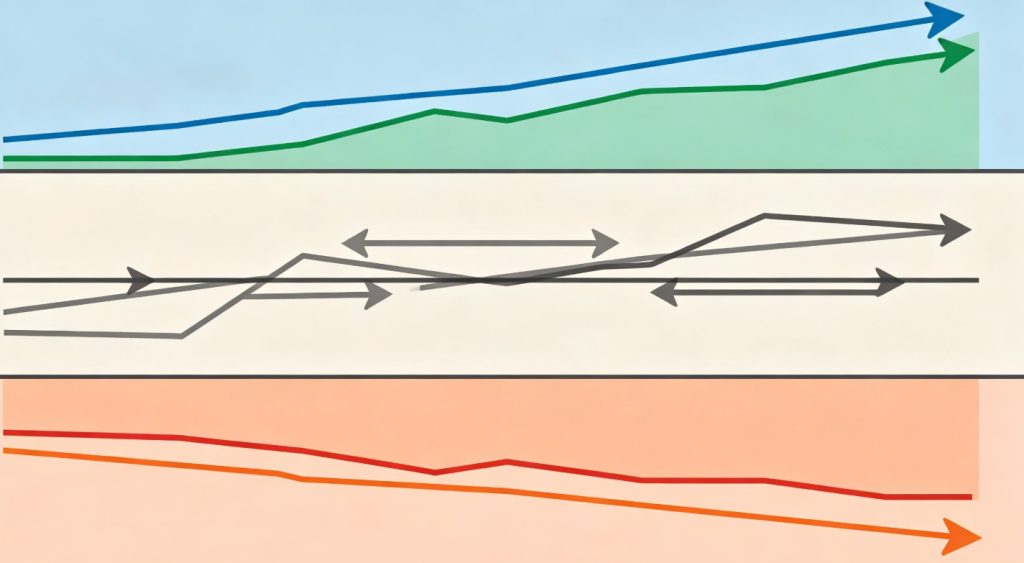
✅ 1. Uptrend
An uptrend occurs when the price stays consistently above the moving average line, and the moving average itself is sloping upward. In this scenario, the moving average acts as a dynamic support level — when the price pulls back to touch or slightly dip below the line, it often bounces back up.
Rule of Thumb: If price > MA and MA is rising = Look for buying opportunities.
🔻 2. Downtrend
A downtrend happens when the price remains below the moving average line, and the line slopes downward. Here, the moving average acts as dynamic resistance — when the price rises to meet the line, it usually falls back down.
Rule of Thumb: If price < MA and MA is falling = Look for selling opportunities or stay out of long positions.
↔️ 3. Sideways / Range-Bound Market
When the price moves back and forth across the moving average line, and the line itself is flat or horizontal, the market has no clear direction. This means there is no strong trend, and you should avoid using trend-following strategies during this time.
Rule of Thumb: If price crosses above and below MA frequently and MA is flat = Trend is unclear; wait for a breakout.
Best Time Periods for Moving Averages
The length of the period you choose changes how sensitive the indicator is. Shorter periods react quickly but are more volatile; longer periods are smoother but slower. Here are the most popular settings used by traders:
- Short-term: 9, 10, or 20 periods — good for day trading and quick trends.
- Medium-term: 50 periods — the most widely used standard for identifying the main trend direction.
- Long-term: 100 or 200 periods — used to see the big picture and major trend strength.
Many traders combine two moving averages to get clearer signals. For example, when the shorter MA crosses above the longer MA, it signals a potential start of an uptrend (Golden Cross). When the shorter MA crosses below, it signals a potential downtrend (Death Cross).
Important Tips for Using Moving Averages
- Use them as a guide, not a guarantee: Moving averages work best in trending markets; they give bad signals in sideways markets.
- Combine with other tools: For better results, use moving averages alongside support/resistance levels, volume, or other indicators like RSI or MACD.
- Choose the right provider: To get accurate price data and clear charts, it is important to trade through a reliable platform. If you are looking for trusted information and comparisons, you can review options and details on broker reviews and ratings to help you select a service that offers high-quality charting tools.
- Avoid overloading your chart: Using too many moving averages at once can create confusion. Stick to 1 or 2 periods that fit your trading style.
- Always apply risk management: No indicator is 100% accurate. Even when a trend looks strong, always use stop-loss orders to protect your capital.
Final Thoughts
Moving averages are the foundation of technical analysis for a reason: they are simple, versatile, and effective. They turn complex price data into easy-to-read lines that tell you exactly which direction the market is moving. Whether you are a beginner or an experienced trader, learning how to read and use moving averages will help you filter out noise, confirm trends, and trade with the flow of the market rather than against it.
Remember, consistency is key. Practice using different types and periods on a demo account first, observe how they react, and develop rules that fit your strategy. Over time, this tool will become one of your most reliable allies in the markets.
Disclaimer: This content is for educational and informational purposes only and does not constitute financial advice, investment recommendation, or solicitation to trade any financial instrument. Technical analysis tools, including moving averages, do not guarantee future results. Trading involves significant risk of loss and is not suitable for all investors. Always ensure you understand the risks involved and consult a qualified financial advisor if needed.